Great UK WaterBlitz Spring 2026
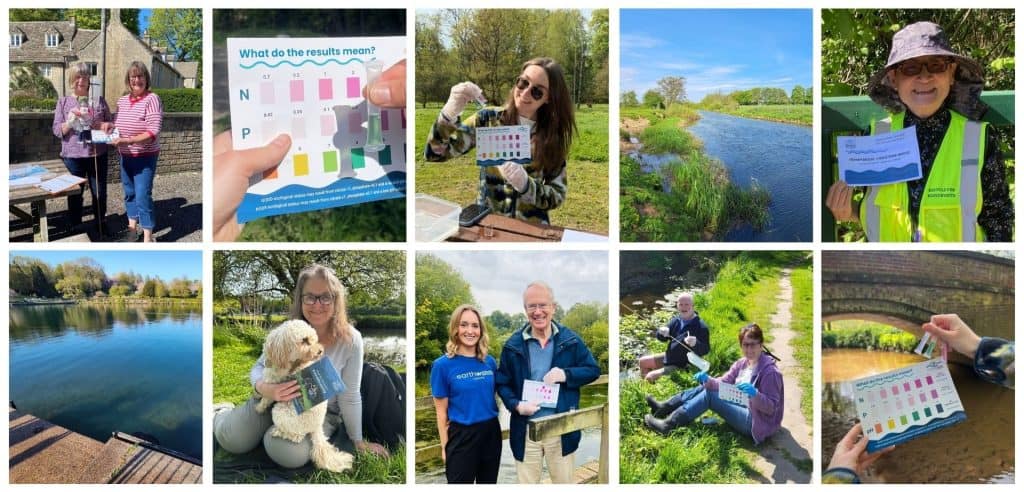
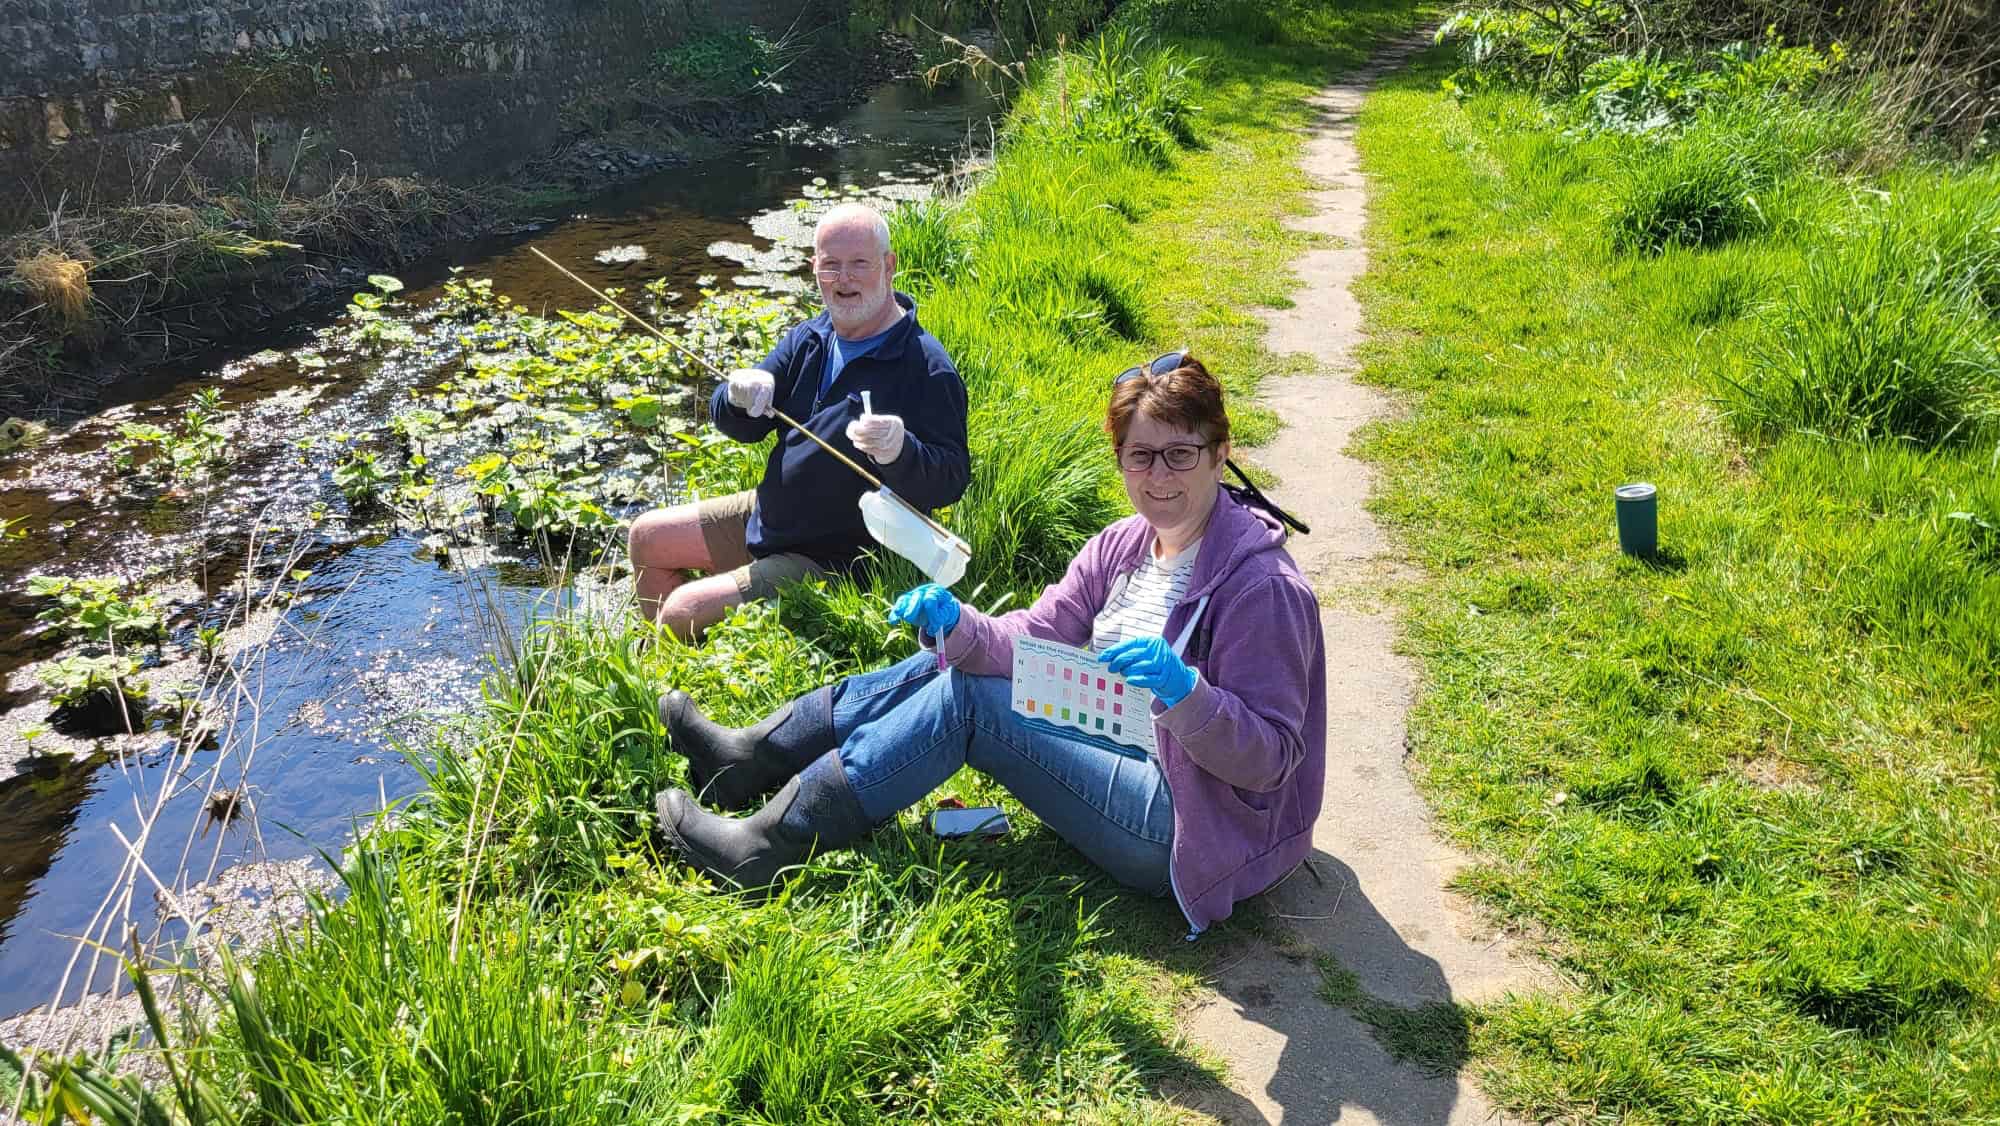
Between 24-27 April 2026, 4,677 citizen scientists surveyed 2,315 freshwater sites, creating a comprehensive citizen-led snapshot of water quality across the UK.
The results have now been analysed and our full report is ready to share!
The report’s key findings:
- 57% of datapoints across the UK showed poor water quality, with unacceptable levels of nutrient pollution
- Over five WaterBlitzes, England consistently shows the worst water quality in the UK; this spring 61% of sites tested had unacceptable levels of nutrient pollution
- Wales had the best national result of any WaterBlitz, with only 18% of sites showing unacceptable water quality
- The counties of Bristol and Rutland had the worst water quality in the UK, with all measurements indicating unacceptable water quality
- The Lune and the Kent & Leven river basins in the north west of England showed 100% good water quality, as did the Welsh Severn Uplands in Wales
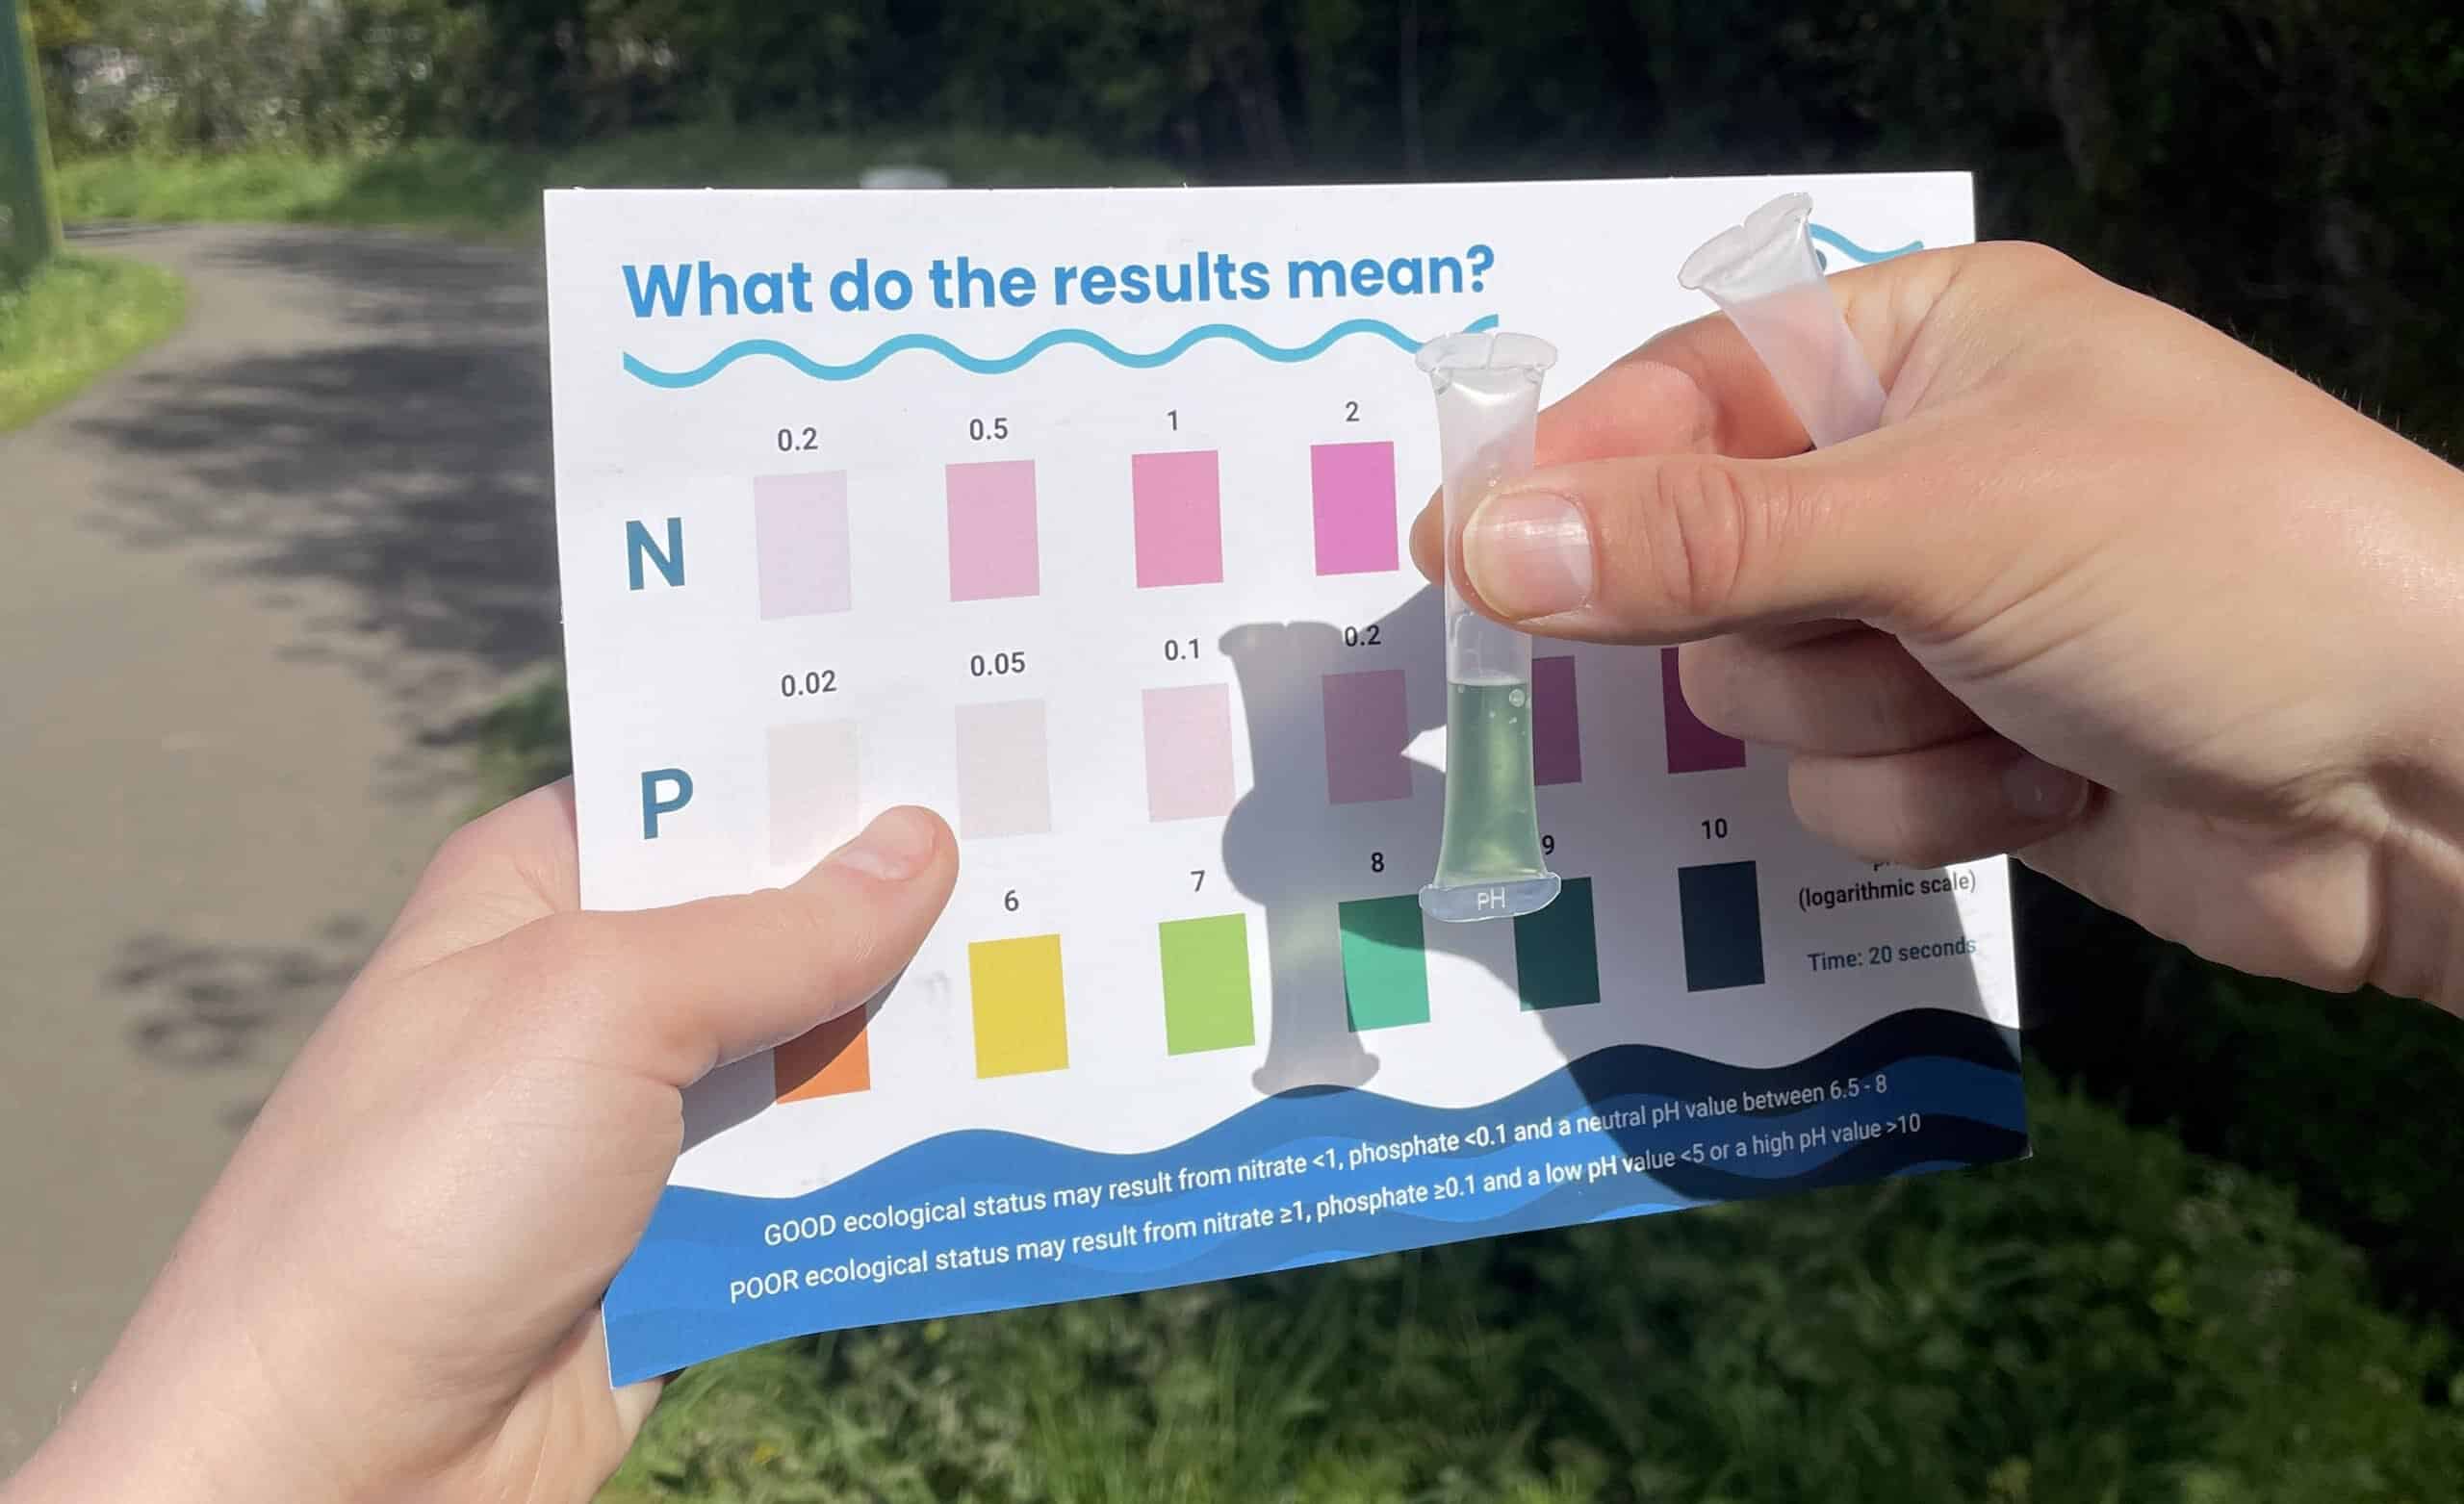
- pH was also measured, as an initial step towards using citizen science data to better interpret phosphate concentrations relative to UK site- specific thresholds
Freshwater quality across the UK
Thousands of citizen scientists uploaded data from across the UK between 24-27 April 2026. Of the 2,315 surveys, 2,038 were collected in England, 140 were collected in Scotland, 112 measurements were taken in Wales, and 25 datapoints were gathered in Northern Ireland.
The data indicated that England has the worst water quality in the UK, which is consistent with the findings of the four previous Great UK WaterBlitz events.
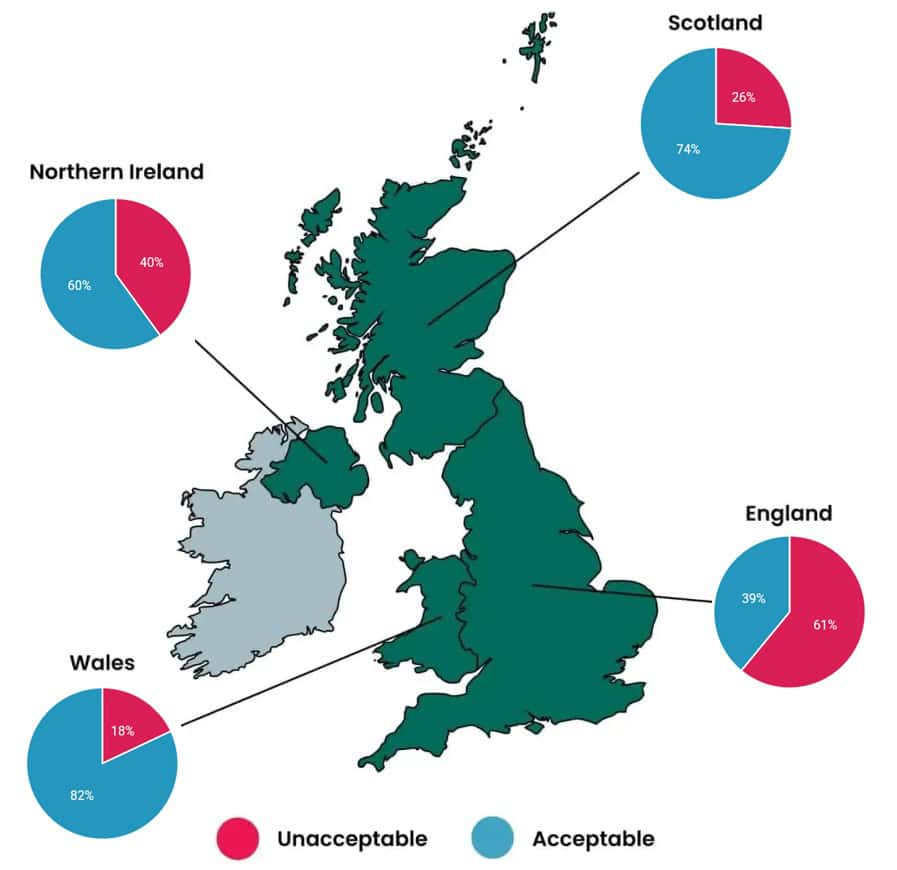
61% of measurements taken across England’s freshwater bodies indicated unacceptable levels of nutrient pollution. In comparison, only 18% of measurements in Wales, 26% of measurements in Scotland, and 40% of measurements in Northern Ireland showed poor water quality.
As we continue to collect more data over repeated WaterBlitz events each spring and autumn, the findings of previous events are confirmed as a trend.
What have we learnt over the last five events?
Taking the average across all five Great UK WaterBlitz events so far, 69% of measurements in Wales, 66% of measurements in Scotland, and 65% of measurements in Northern Ireland indicate low nutrient concentrations and therefore good water quality.
In comparison, only a small 31% of average measurements in England indicate good water quality.
Why is nutrient pollution such a problem?
Nitrates and phosphates occur naturally in the environment and are essential for plant growth.
However, in high concentrations, nitrates and phosphates can lead to a process called eutrophication. This process is when excessive plant and algal growth (caused by the extra nutrients) leads to high levels of bacteria. The bacteria decrease oxygen levels in the water, killing plants and animals.
Lots of algae on the water surface can also choke waterways, preventing wildlife from feeding, and blocking sunlight, causing further problems for aquatic plants. Over time, with continued high levels of nutrients, river ecosystems can fail.
Are you concerned about the results in your county?
Share your regional WaterBlitz results with your MP and make them aware of what has been discovered.
Ask them to support laws that protect and enhance our precious waterways, putting planet over profit.
The louder your voice, the bigger the change.
Explore water quality in your county:
Tyrone
We did not receive enough data points from Tyrone to undertake meaningful analysis of the county’s water quality. However, in Northern Ireland, we analysed 16 datapoints, of which, 40% were found to have unacceptable levels of nutrient pollution.
You can explore all of the datapoints from England and the whole of the UK on the interactive Great UK WaterBlitz map.
Our next Great UK WaterBlitz event will take place over four days in September.
Ongoing water testing throughout these events is crucial for establishing a comprehensive and dynamic picture of the nation’s freshwater health, enabling the identification of pollution hotspots, tracking changes over time, and providing vital data to advocate for stronger environmental policies.
If you are interested in taking part, fill in this form to get early access to the next event.
Londonderry
We did not receive enough data points from Londonderry to undertake meaningful analysis of the county’s water quality. However, in Northern Ireland, we analysed 16 datapoints, of which, 40% were found to have unacceptable levels of nutrient pollution.
You can explore all of the datapoints from England and the whole of the UK on the interactive Great UK WaterBlitz map.
Our next Great UK WaterBlitz event will take place over four days in September.
Ongoing water testing throughout these events is crucial for establishing a comprehensive and dynamic picture of the nation’s freshwater health, enabling the identification of pollution hotspots, tracking changes over time, and providing vital data to advocate for stronger environmental policies.
If you are interested in taking part, fill in this form to get early access to the next event.
Fermanagh
We did not receive enough data points from Fermanagh to undertake meaningful analysis of the county’s water quality. However, in Northern Ireland, we analysed 16 datapoints, of which, 40% were found to have unacceptable levels of nutrient pollution.
You can explore all of the datapoints from England and the whole of the UK on the interactive Great UK WaterBlitz map.
Our next Great UK WaterBlitz event will take place over four days in September.
Ongoing water testing throughout these events is crucial for establishing a comprehensive and dynamic picture of the nation’s freshwater health, enabling the identification of pollution hotspots, tracking changes over time, and providing vital data to advocate for stronger environmental policies.
If you are interested in taking part, fill in this form to get early access to the next event.
Armagh
We did not receive enough data points from Armagh to undertake meaningful analysis of the county’s water quality. However, in Northern Ireland, we analysed 16 datapoints, of which, 40% were found to have unacceptable levels of nutrient pollution.
You can explore all of the datapoints from England and the whole of the UK on the interactive Great UK WaterBlitz map.
Our next Great UK WaterBlitz event will take place over four days in September.
Ongoing water testing throughout these events is crucial for establishing a comprehensive and dynamic picture of the nation’s freshwater health, enabling the identification of pollution hotspots, tracking changes over time, and providing vital data to advocate for stronger environmental policies.
If you are interested in taking part, fill in this form to get early access to the next event.
Argyll and Bute
We did not receive enough data points from Argyll and Bute to undertake meaningful analysis of the county’s water quality. However, in Scotland, we analysed 106 datapoints, of which, 26% were found to have unacceptable levels of nutrient pollution.
You can explore all of the datapoints from England and the whole of the UK on the interactive Great UK WaterBlitz map.
Our next Great UK WaterBlitz event will take place over four days in September.
Ongoing water testing throughout these events is crucial for establishing a comprehensive and dynamic picture of the nation’s freshwater health, enabling the identification of pollution hotspots, tracking changes over time, and providing vital data to advocate for stronger environmental policies.
If you are interested in taking part, fill in this form to get early access to the next event.
Shetland
We did not receive enough data points from Shetland to undertake meaningful analysis of the county’s water quality. However, in Scotland, we analysed 106 datapoints, of which, 26% were found to have unacceptable levels of nutrient pollution.
You can explore all of the datapoints from England and the whole of the UK on the interactive Great UK WaterBlitz map.
Our next Great UK WaterBlitz event will take place over four days in September.
Ongoing water testing throughout these events is crucial for establishing a comprehensive and dynamic picture of the nation’s freshwater health, enabling the identification of pollution hotspots, tracking changes over time, and providing vital data to advocate for stronger environmental policies.
If you are interested in taking part, fill in this form to get early access to the next event.
Orkney
We did not receive enough data points from Orkney to undertake meaningful analysis of the county’s water quality. However, in Scotland, we analysed 106 datapoints, of which, 26% were found to have unacceptable levels of nutrient pollution.
You can explore all of the datapoints from England and the whole of the UK on the interactive Great UK WaterBlitz map.
Our next Great UK WaterBlitz event will take place over four days in September.
Ongoing water testing throughout these events is crucial for establishing a comprehensive and dynamic picture of the nation’s freshwater health, enabling the identification of pollution hotspots, tracking changes over time, and providing vital data to advocate for stronger environmental policies.
If you are interested in taking part, fill in this form to get early access to the next event.
Western Isles
We did not receive enough data points from Western Isles to undertake meaningful analysis of the county’s water quality. However, in Scotland, we analysed 106 datapoints, of which, 26% were found to have unacceptable levels of nutrient pollution.
You can explore all of the datapoints from England and the whole of the UK on the interactive Great UK WaterBlitz map.
Our next Great UK WaterBlitz event will take place over four days in September.
Ongoing water testing throughout these events is crucial for establishing a comprehensive and dynamic picture of the nation’s freshwater health, enabling the identification of pollution hotspots, tracking changes over time, and providing vital data to advocate for stronger environmental policies.
If you are interested in taking part, fill in this form to get early access to the next event.
Berwickshire
We did not receive enough data points from Berwickshire to undertake meaningful analysis of the county’s water quality. However, in Scotland, we analysed 106 datapoints, of which, 26% were found to have unacceptable levels of nutrient pollution.
You can explore all of the datapoints from England and the whole of the UK on the interactive Great UK WaterBlitz map.
Our next Great UK WaterBlitz event will take place over four days in September.
Ongoing water testing throughout these events is crucial for establishing a comprehensive and dynamic picture of the nation’s freshwater health, enabling the identification of pollution hotspots, tracking changes over time, and providing vital data to advocate for stronger environmental policies.
If you are interested in taking part, fill in this form to get early access to the next event.
Dumfries
We did not receive enough data points from Dumfries to undertake meaningful analysis of the county’s water quality. However, in Scotland, we analysed 106 datapoints, of which, 26% were found to have unacceptable levels of nutrient pollution.
You can explore all of the datapoints from England and the whole of the UK on the interactive Great UK WaterBlitz map.
Our next Great UK WaterBlitz event will take place over four days in September.
Ongoing water testing throughout these events is crucial for establishing a comprehensive and dynamic picture of the nation’s freshwater health, enabling the identification of pollution hotspots, tracking changes over time, and providing vital data to advocate for stronger environmental policies.
If you are interested in taking part, fill in this form to get early access to the next event.
Moray
We did not receive enough data points from Moray to undertake meaningful analysis of the county’s water quality. However, in Scotland, we analysed 106 datapoints, of which, 26% were found to have unacceptable levels of nutrient pollution.
You can explore all of the datapoints from England and the whole of the UK on the interactive Great UK WaterBlitz map.
Our next Great UK WaterBlitz event will take place over four days in September.
Ongoing water testing throughout these events is crucial for establishing a comprehensive and dynamic picture of the nation’s freshwater health, enabling the identification of pollution hotspots, tracking changes over time, and providing vital data to advocate for stronger environmental policies.
If you are interested in taking part, fill in this form to get early access to the next event.
Banffshire
We did not receive enough data points from Banffshire to undertake meaningful analysis of the county’s water quality. However, in Scotland, we analysed 106 datapoints, of which, 26% were found to have unacceptable levels of nutrient pollution.
You can explore all of the datapoints from England and the whole of the UK on the interactive Great UK WaterBlitz map.
Our next Great UK WaterBlitz event will take place over four days in September.
Ongoing water testing throughout these events is crucial for establishing a comprehensive and dynamic picture of the nation’s freshwater health, enabling the identification of pollution hotspots, tracking changes over time, and providing vital data to advocate for stronger environmental policies.
If you are interested in taking part, fill in this form to get early access to the next event.
Renfrewshire
We did not receive enough data points from Renfrewshire to undertake meaningful analysis of the county’s water quality. However, in Scotland, we analysed 106 datapoints, of which, 26% were found to have unacceptable levels of nutrient pollution.
You can explore all of the datapoints from England and the whole of the UK on the interactive Great UK WaterBlitz map.
Our next Great UK WaterBlitz event will take place over four days in September.
Ongoing water testing throughout these events is crucial for establishing a comprehensive and dynamic picture of the nation’s freshwater health, enabling the identification of pollution hotspots, tracking changes over time, and providing vital data to advocate for stronger environmental policies.
If you are interested in taking part, fill in this form to get early access to the next event.
Ayrshire and Arran
We did not receive enough data points from Ayrshire and Arran to undertake meaningful analysis of the county’s water quality. However, in Scotland, we analysed 106 datapoints, of which, 26% were found to have unacceptable levels of nutrient pollution.
You can explore all of the datapoints from England and the whole of the UK on the interactive Great UK WaterBlitz map.
Our next Great UK WaterBlitz event will take place over four days in September.
Ongoing water testing throughout these events is crucial for establishing a comprehensive and dynamic picture of the nation’s freshwater health, enabling the identification of pollution hotspots, tracking changes over time, and providing vital data to advocate for stronger environmental policies.
If you are interested in taking part, fill in this form to get early access to the next event.
City of Dundee
We did not receive enough data points from City of Dundee to undertake meaningful analysis of the county’s water quality. However, in Scotland, we analysed 106 datapoints, of which, 26% were found to have unacceptable levels of nutrient pollution.
You can explore all of the datapoints from England and the whole of the UK on the interactive Great UK WaterBlitz map.
Our next Great UK WaterBlitz event will take place over four days in September.
Ongoing water testing throughout these events is crucial for establishing a comprehensive and dynamic picture of the nation’s freshwater health, enabling the identification of pollution hotspots, tracking changes over time, and providing vital data to advocate for stronger environmental policies.
If you are interested in taking part, fill in this form to get early access to the next event.
West Lothian
We did not receive enough data points from West Lothian to undertake meaningful analysis of the county’s water quality. However, in Scotland, we analysed 106 datapoints, of which, 26% were found to have unacceptable levels of nutrient pollution.
You can explore all of the datapoints from England and the whole of the UK on the interactive Great UK WaterBlitz map.
Our next Great UK WaterBlitz event will take place over four days in September.
Ongoing water testing throughout these events is crucial for establishing a comprehensive and dynamic picture of the nation’s freshwater health, enabling the identification of pollution hotspots, tracking changes over time, and providing vital data to advocate for stronger environmental policies.
If you are interested in taking part, fill in this form to get early access to the next event.
Sutherland
We did not receive enough data points from Sutherland to undertake meaningful analysis of the county’s water quality. However, in Scotland, we analysed 106 datapoints, of which, 26% were found to have unacceptable levels of nutrient pollution.
You can explore all of the datapoints from England and the whole of the UK on the interactive Great UK WaterBlitz map.
Our next Great UK WaterBlitz event will take place over four days in September.
Ongoing water testing throughout these events is crucial for establishing a comprehensive and dynamic picture of the nation’s freshwater health, enabling the identification of pollution hotspots, tracking changes over time, and providing vital data to advocate for stronger environmental policies.
If you are interested in taking part, fill in this form to get early access to the next event.
Ross and Cromarty
We did not receive enough data points from Ross and Cromarty to undertake meaningful analysis of the county’s water quality. However, in Scotland, we analysed 106 datapoints, of which, 26% were found to have unacceptable levels of nutrient pollution.
You can explore all of the datapoints from England and the whole of the UK on the interactive Great UK WaterBlitz map.
Our next Great UK WaterBlitz event will take place over four days in September.
Ongoing water testing throughout these events is crucial for establishing a comprehensive and dynamic picture of the nation’s freshwater health, enabling the identification of pollution hotspots, tracking changes over time, and providing vital data to advocate for stronger environmental policies.
If you are interested in taking part, fill in this form to get early access to the next event.
Nairn
We did not receive enough data points from Nairn to undertake meaningful analysis of the county’s water quality. However, in Scotland, we analysed 106 datapoints, of which, 26% were found to have unacceptable levels of nutrient pollution.
You can explore all of the datapoints from England and the whole of the UK on the interactive Great UK WaterBlitz map.
Our next Great UK WaterBlitz event will take place over four days in September.
Ongoing water testing throughout these events is crucial for establishing a comprehensive and dynamic picture of the nation’s freshwater health, enabling the identification of pollution hotspots, tracking changes over time, and providing vital data to advocate for stronger environmental policies.
If you are interested in taking part, fill in this form to get early access to the next event.
Caithness
We did not receive enough data points from Caithness to undertake meaningful analysis of the county’s water quality. However, in Scotland, we analysed 106 datapoints, of which, 26% were found to have unacceptable levels of nutrient pollution.
You can explore all of the datapoints from England and the whole of the UK on the interactive Great UK WaterBlitz map.
Our next Great UK WaterBlitz event will take place over four days in September.
Ongoing water testing throughout these events is crucial for establishing a comprehensive and dynamic picture of the nation’s freshwater health, enabling the identification of pollution hotspots, tracking changes over time, and providing vital data to advocate for stronger environmental policies.
If you are interested in taking part, fill in this form to get early access to the next event.
Inverness
We did not receive enough data points from Inverness to undertake meaningful analysis of the county’s water quality. However, in Scotland, we analysed 106 datapoints, of which, 26% were found to have unacceptable levels of nutrient pollution.
You can explore all of the datapoints from England and the whole of the UK on the interactive Great UK WaterBlitz map.
Our next Great UK WaterBlitz event will take place over four days in September.
Ongoing water testing throughout these events is crucial for establishing a comprehensive and dynamic picture of the nation’s freshwater health, enabling the identification of pollution hotspots, tracking changes over time, and providing vital data to advocate for stronger environmental policies.
If you are interested in taking part, fill in this form to get early access to the next event.
Stirling and Falkirk
We did not receive enough data points from Stirling and Falkirk to undertake meaningful analysis of the county’s water quality. However, in Scotland, we analysed 106 datapoints, of which, 26% were found to have unacceptable levels of nutrient pollution.
You can explore all of the datapoints from England and the whole of the UK on the interactive Great UK WaterBlitz map.
Our next Great UK WaterBlitz event will take place over four days in September.
Ongoing water testing throughout these events is crucial for establishing a comprehensive and dynamic picture of the nation’s freshwater health, enabling the identification of pollution hotspots, tracking changes over time, and providing vital data to advocate for stronger environmental policies.
If you are interested in taking part, fill in this form to get early access to the next event.
Wigtown
We did not receive enough data points from Wigtown to undertake meaningful analysis of the county’s water quality. However, in Scotland, we analysed 106 datapoints, of which, 26% were found to have unacceptable levels of nutrient pollution.
You can explore all of the datapoints from England and the whole of the UK on the interactive Great UK WaterBlitz map.
Our next Great UK WaterBlitz event will take place over four days in September.
Ongoing water testing throughout these events is crucial for establishing a comprehensive and dynamic picture of the nation’s freshwater health, enabling the identification of pollution hotspots, tracking changes over time, and providing vital data to advocate for stronger environmental policies.
If you are interested in taking part, fill in this form to get early access to the next event.
Mid Glamorgan
We did not receive enough data points from Mid Glamorgan to undertake meaningful analysis of the county’s water quality. However, in Wales, we analysed 108 datapoints, of which, 18% were found to have unacceptable levels of nutrient pollution.
You can explore all of the datapoints from England and the whole of the UK on the interactive Great UK WaterBlitz map.
Our next Great UK WaterBlitz event will take place over four days in September.
Ongoing water testing throughout these events is crucial for establishing a comprehensive and dynamic picture of the nation’s freshwater health, enabling the identification of pollution hotspots, tracking changes over time, and providing vital data to advocate for stronger environmental policies.
If you are interested in taking part, fill in this form to get early access to the next event.
Isle of Wight
We did not receive enough data points from Isle of Wight to undertake meaningful analysis of the county’s water quality. However, in England, we analysed 2033 datapoints, of which, 61% were found to have unacceptable levels of nutrient pollution.
You can explore all of the datapoints from England and the whole of the UK on the interactive Great UK WaterBlitz map.
Our next Great UK WaterBlitz event will take place over four days in September.
Ongoing water testing throughout these events is crucial for establishing a comprehensive and dynamic picture of the nation’s freshwater health, enabling the identification of pollution hotspots, tracking changes over time, and providing vital data to advocate for stronger environmental policies.
If you are interested in taking part, fill in this form to get early access to the next event.
City of Glasgow
We did not receive enough data points from City of Glasgow to undertake meaningful analysis of the county’s water quality. However, in Scotland, we analysed 106 datapoints, of which, 26% were found to have unacceptable levels of nutrient pollution.
You can explore all of the datapoints from England and the whole of the UK on the interactive Great UK WaterBlitz map.
Our next Great UK WaterBlitz event will take place over four days in September.
Ongoing water testing throughout these events is crucial for establishing a comprehensive and dynamic picture of the nation’s freshwater health, enabling the identification of pollution hotspots, tracking changes over time, and providing vital data to advocate for stronger environmental policies.
If you are interested in taking part, fill in this form to get early access to the next event.
Lanarkshire
We did not receive enough data points from Lanarkshire to undertake meaningful analysis of the county’s water quality. However, in Scotland, we analysed 106 datapoints, of which, 26% were found to have unacceptable levels of nutrient pollution.
You can explore all of the datapoints from Scotland and the whole of the UK on the interactive Great UK WaterBlitz map.
Our next Great UK WaterBlitz event will take place over four days in September.
Ongoing water testing throughout these events is crucial for establishing a comprehensive and dynamic picture of the nation’s freshwater health, enabling the identification of pollution hotspots, tracking changes over time, and providing vital data to advocate for stronger environmental policies.
If you are interested in taking part, fill in this form to get early access to the next event.
Midlothian
We did not receive enough data points from Midlothian to undertake meaningful analysis of the county’s water quality. However, in Scotland, we analysed 106 datapoints, of which, 26% were found to have unacceptable levels of nutrient pollution.
You can explore all of the datapoints from England and the whole of the UK on the interactive Great UK WaterBlitz map.
Our next Great UK WaterBlitz event will take place over four days in September.
Ongoing water testing throughout these events is crucial for establishing a comprehensive and dynamic picture of the nation’s freshwater health, enabling the identification of pollution hotspots, tracking changes over time, and providing vital data to advocate for stronger environmental policies.
If you are interested in taking part, fill in this form to get early access to the next event.
Clackmannan
We did not receive enough data points from Clackmannan to undertake meaningful analysis of the county’s water quality. However, in Scotland, we analysed 106 datapoints, of which, 26% were found to have unacceptable levels of nutrient pollution.
You can explore all of the datapoints from England and the whole of the UK on the interactive Great UK WaterBlitz map.
Our next Great UK WaterBlitz event will take place over four days in September.
Ongoing water testing throughout these events is crucial for establishing a comprehensive and dynamic picture of the nation’s freshwater health, enabling the identification of pollution hotspots, tracking changes over time, and providing vital data to advocate for stronger environmental policies.
If you are interested in taking part, fill in this form to get early access to the next event.
Down
In Down, we analysed 7 data points. Of these data points, 71% showed unacceptable levels of nutrient pollution. This compares to 40% in Northern Ireland overall, meaning that Down had worse than average water quality.
Northern Ireland’s freshwater sites demonstrate significantly better conditions compared to England, where 61% of water samples showed unacceptable levels of nutrient pollution.
You can explore all of the datapoints from Northern Ireland and the whole of the UK on the interactive Great UK WaterBlitz map. Despite its relatively clean freshwater, the presence of unacceptable pollution levels in over a third of Northern Ireland’s tested sites highlights that challenges remain.
Our next Great UK WaterBlitz event will take place over four days in September.
Ongoing water testing throughout these events is crucial for establishing a comprehensive and dynamic picture of the nation’s freshwater health, enabling the identification of pollution hotspots, tracking changes over time, and providing vital data to advocate for stronger environmental policies.
If you are interested in taking part, fill in this form to get early access to the next event.
Antrim
In Antrim, we analysed 9 data points. Of these data points, 33% showed unacceptable levels of nutrient pollution. This compares to 40% in Northern Ireland overall, meaning that Antrim had better than average water quality.
Northern Ireland’s freshwater sites demonstrate significantly better conditions compared to England, where 61% of water samples showed unacceptable levels of nutrient pollution.
You can explore all of the datapoints from Northern Ireland and the whole of the UK on the interactive Great UK WaterBlitz map. Despite its relatively clean freshwater, the presence of unacceptable pollution levels in over a third of Northern Ireland’s tested sites highlights that challenges remain.
Our next Great UK WaterBlitz event will take place over four days in September.
Ongoing water testing throughout these events is crucial for establishing a comprehensive and dynamic picture of the nation’s freshwater health, enabling the identification of pollution hotspots, tracking changes over time, and providing vital data to advocate for stronger environmental policies.
If you are interested in taking part, fill in this form to get early access to the next event.
Cornwall
In Cornwall, we analysed 39 data points. Of these data points, 46% showed unacceptable levels of nutrient pollution. This compares to 61% in England overall, meaning that Cornwall had better than average water quality.
You can explore all of the datapoints from England and the whole of the UK on the interactive Great UK WaterBlitz map.
Our next Great UK WaterBlitz event will take place over four days in September.
Ongoing water testing throughout these events is crucial for establishing a comprehensive and dynamic picture of the nation’s freshwater health, enabling the identification of pollution hotspots, tracking changes over time, and providing vital data to advocate for stronger environmental policies.
If you are interested in taking part, fill in this form to get early access to the next event.
Northumberland
In Northumberland, we analysed 21 data points. Of these data points, 14% showed unacceptable levels of nutrient pollution. This compares to 61% in England overall, meaning that Northumberland had better than average water quality.
You can explore all of the datapoints from England and the whole of the UK on the interactive Great UK WaterBlitz map.
Our next Great UK WaterBlitz event will take place over four days in September.
Ongoing water testing throughout these events is crucial for establishing a comprehensive and dynamic picture of the nation’s freshwater health, enabling the identification of pollution hotspots, tracking changes over time, and providing vital data to advocate for stronger environmental policies.
If you are interested in taking part, fill in this form to get early access to the next event.
Cumbria
In Cumbria, we analysed 34 data points. Of these data points, 21% showed unacceptable levels of nutrient pollution. This compares to 61% in England overall, meaning that Cumbria had better than average water quality.
You can explore all of the datapoints from England and the whole of the UK on the interactive Great UK WaterBlitz map.
Our next Great UK WaterBlitz event will take place over four days in September.
Ongoing water testing throughout these events is crucial for establishing a comprehensive and dynamic picture of the nation’s freshwater health, enabling the identification of pollution hotspots, tracking changes over time, and providing vital data to advocate for stronger environmental policies.
If you are interested in taking part, fill in this form to get early access to the next event.
Aberdeenshire
In Aberdeenshire, we analysed 19 data points. Of these data points, 16% showed unacceptable levels of nutrient pollution. This compares to 26% in Scotland overall, meaning that Aberdeenshire had better than average water quality.
Freshwater sites in Scotland demonstrate significantly better conditions compared to England, where 61% of water samples showed unacceptable levels of nutrient pollution. You can explore all of the datapoints from Scotland and the whole of the UK on the interactive Great UK WaterBlitz map. Despite its relatively clean freshwater, the presence of unacceptable pollution levels in some of Scotland’s tested sites highlights that challenges remain.
Our next Great UK WaterBlitz event will take place over four days in September.
Ongoing water testing throughout these events is crucial for establishing a comprehensive and dynamic picture of the nation’s freshwater health, enabling the identification of pollution hotspots, tracking changes over time, and providing vital data to advocate for stronger environmental policies.
If you are interested in taking part, fill in this form to get early access to the next event.
Kincardineshire
In Kincardineshire, we analysed 10 data points. Of these data points, 30% showed unacceptable levels of nutrient pollution. This compares to 26% in Scotland overall, meaning that Kincardineshire had slightly worse than average water quality.
However, freshwater sites in Scotland demonstrate significantly better conditions compared to England, where 61% of water samples showed unacceptable levels of nutrient pollution. You can explore all of the datapoints from Scotland and the whole of the UK on the interactive Great UK WaterBlitz map. Despite its relatively clean freshwater, the presence of unacceptable pollution levels in some of Scotland’s tested sites highlights that challenges remain.
Our next Great UK WaterBlitz event will take place over four days in September.
Ongoing water testing throughout these events is crucial for establishing a comprehensive and dynamic picture of the nation’s freshwater health, enabling the identification of pollution hotspots, tracking changes over time, and providing vital data to advocate for stronger environmental policies.
If you are interested in taking part, fill in this form to get early access to the next event.
City of Aberdeen
In the City of Aberdeen, we analysed 7 data points. Of these data points, 0% showed unacceptable levels of nutrient pollution. This compares to 26% in Scotland overall, meaning that the City of Aberdeen had better than average water quality.
Freshwater sites in Scotland demonstrate significantly better conditions compared to England, where 61% of water samples showed unacceptable levels of nutrient pollution. You can explore all of the datapoints from Scotland and the whole of the UK on the interactive Great UK WaterBlitz map. Despite its relatively clean freshwater, the presence of unacceptable pollution levels in some of Scotland’s tested sites highlights that challenges remain.
Our next Great UK WaterBlitz event will take place over four days in September.
Ongoing water testing throughout these events is crucial for establishing a comprehensive and dynamic picture of the nation’s freshwater health, enabling the identification of pollution hotspots, tracking changes over time, and providing vital data to advocate for stronger environmental policies.
If you are interested in taking part, fill in this form to get early access to the next event.
Dunbartonshire
In Dunbartonshire, we analysed 7 data points. Of these data points, 14% showed unacceptable levels of nutrient pollution. This compares to 26% in Scotland overall, meaning that Dunbartonshire had better than average water quality.
Freshwater sites in Scotland demonstrate significantly better conditions compared to England, where 61% of water samples showed unacceptable levels of nutrient pollution. You can explore all of the datapoints from Scotland and the whole of the UK on the interactive Great UK WaterBlitz map. Despite its relatively clean freshwater, the presence of unacceptable pollution levels in some of Scotland’s tested sites highlights that challenges remain.
Our next Great UK WaterBlitz event will take place over four days in September.
Ongoing water testing throughout these events is crucial for establishing a comprehensive and dynamic picture of the nation’s freshwater health, enabling the identification of pollution hotspots, tracking changes over time, and providing vital data to advocate for stronger environmental policies.
If you are interested in taking part, fill in this form to get early access to the next event.
Perth and Kinross
In Perth and Kinross, we analysed 13 data points. Of these data points, 8% showed unacceptable levels of nutrient pollution. This compares to 26% in Scotland overall, meaning that Perth and Kinross had better than average water quality.
Freshwater sites in Scotland demonstrate significantly better conditions compared to England, where 61% of water samples showed unacceptable levels of nutrient pollution. You can explore all of the datapoints from Scotland and the whole of the UK on the interactive Great UK WaterBlitz map. Despite its relatively clean freshwater, the presence of unacceptable pollution levels in some of Scotland’s tested sites highlights that challenges remain.
Our next Great UK WaterBlitz event will take place over four days in September.
Ongoing water testing throughout these events is crucial for establishing a comprehensive and dynamic picture of the nation’s freshwater health, enabling the identification of pollution hotspots, tracking changes over time, and providing vital data to advocate for stronger environmental policies.
If you are interested in taking part, fill in this form to get early access to the next event.
Angus
In Angus, we analysed 5 data points. Of these data points, 40% showed unacceptable levels of nutrient pollution. This compares to 26% in Scotland overall, meaning that Angus had worse than average water quality.
However, freshwater sites in Scotland demonstrate significantly better conditions compared to England, where 61% of water samples showed unacceptable levels of nutrient pollution. You can explore all of the datapoints from Scotland and the whole of the UK on the interactive Great UK WaterBlitz map. Despite its relatively clean freshwater, the presence of unacceptable pollution levels in some of Scotland’s tested sites highlights that challenges remain.
Our next Great UK WaterBlitz event will take place over four days in September.
Ongoing water testing throughout these events is crucial for establishing a comprehensive and dynamic picture of the nation’s freshwater health, enabling the identification of pollution hotspots, tracking changes over time, and providing vital data to advocate for stronger environmental policies.
If you are interested in taking part, fill in this form to get early access to the next event.
East Lothian
In East Lothian, we analysed 7 data points. Of these data points, 71% showed unacceptable levels of nutrient pollution. This compares to 26% in Scotland overall, meaning that East Lothian had worse than average water quality.
However, freshwater sites in Scotland demonstrate significantly better conditions compared to England, where 61% of water samples showed unacceptable levels of nutrient pollution. You can explore all of the datapoints from Scotland and the whole of the UK on the interactive Great UK WaterBlitz map. Despite its relatively clean freshwater, the presence of unacceptable pollution levels in some of Scotland’s tested sites highlights that challenges remain.
Our next Great UK WaterBlitz event will take place over four days in September.
Ongoing water testing throughout these events is crucial for establishing a comprehensive and dynamic picture of the nation’s freshwater health, enabling the identification of pollution hotspots, tracking changes over time, and providing vital data to advocate for stronger environmental policies.
If you are interested in taking part, fill in this form to get early access to the next event.
City of Edinburgh
In the City of Edinburgh, we analysed 13 data points. Of these data points, 31% showed unacceptable levels of nutrient pollution. This compares to 26% in Scotland overall, meaning that the City of Edinburgh had slightly worse than average water quality.
However, freshwater sites in Scotland demonstrate significantly better conditions compared to England, where 61% of water samples showed unacceptable levels of nutrient pollution. You can explore all of the datapoints from Scotland and the whole of the UK on the interactive Great UK WaterBlitz map. Despite its relatively clean freshwater, the presence of unacceptable pollution levels in some of Scotland’s tested sites highlights that challenges remain.
Our next Great UK WaterBlitz event will take place over four days in September.
Ongoing water testing throughout these events is crucial for establishing a comprehensive and dynamic picture of the nation’s freshwater health, enabling the identification of pollution hotspots, tracking changes over time, and providing vital data to advocate for stronger environmental policies.
If you are interested in taking part, fill in this form to get early access to the next event.
Fife
In Fife, we analysed 11 data points. Of these data points, 64% showed unacceptable levels of nutrient pollution. This compares to 26% in Scotland overall, meaning that Fife had worse than average water quality.
However, freshwater sites in Scotland demonstrate significantly better conditions compared to England, where 61% of water samples showed unacceptable levels of nutrient pollution. You can explore all of the datapoints from Scotland and the whole of the UK on the interactive Great UK WaterBlitz map. Despite its relatively clean freshwater, the presence of unacceptable pollution levels in some of Scotland’s tested sites highlights that challenges remain.
Our next Great UK WaterBlitz event will take place over four days in September.
Ongoing water testing throughout these events is crucial for establishing a comprehensive and dynamic picture of the nation’s freshwater health, enabling the identification of pollution hotspots, tracking changes over time, and providing vital data to advocate for stronger environmental policies.
If you are interested in taking part, fill in this form to get early access to the next event.
The Stewartry of Kirkcudbright
In The Stewartry of Kirkcudbright, we analysed 5 data points. Of these data points, 40% showed unacceptable levels of nutrient pollution. This compares to 26% in Scotland overall, meaning that The Stewartry of Kirkcudbright had worse than average water quality.
However, freshwater sites in Scotland demonstrate significantly better conditions compared to England, where 61% of water samples showed unacceptable levels of nutrient pollution. You can explore all of the datapoints from Scotland and the whole of the UK on the interactive Great UK WaterBlitz map. Despite its relatively clean freshwater, the presence of unacceptable pollution levels in some of Scotland’s tested sites highlights that challenges remain.
Our next Great UK WaterBlitz event will take place over four days in September.
Ongoing water testing throughout these events is crucial for establishing a comprehensive and dynamic picture of the nation’s freshwater health, enabling the identification of pollution hotspots, tracking changes over time, and providing vital data to advocate for stronger environmental policies.
If you are interested in taking part, fill in this form to get early access to the next event.
Gwent
In Gwent, we analysed 14 data points. Of these data points, 7% showed unacceptable levels of nutrient pollution. This compares to 18% in Wales overall, meaning that Gwent had better than average water quality.
Freshwater sites in Wales demonstrate significantly better conditions compared to England, where 61% of water samples showed unacceptable levels of nutrient pollution. You can explore all of the datapoints from Wales and the whole of the UK on the interactive Great UK WaterBlitz map. Despite its relatively clean freshwater, the presence of unacceptable pollution levels in some of Wales’s tested sites highlights that challenges remain.
Our next Great UK WaterBlitz event will take place over four days in September.
Ongoing water testing throughout these events is crucial for establishing a comprehensive and dynamic picture of the nation’s freshwater health, enabling the identification of pollution hotspots, tracking changes over time, and providing vital data to advocate for stronger environmental policies.
If you are interested in taking part, fill in this form to get early access to the next event.
Dyfed
In Dyfed, we analysed 35 data points. Of these data points, 23% showed unacceptable levels of nutrient pollution. This compares to 18% in Wales overall, meaning that Dyfed had slightly worse than average water quality.
However, freshwater sites in Wales demonstrate significantly better conditions compared to England, where 61% of water samples showed unacceptable levels of nutrient pollution. You can explore all of the datapoints from Wales and the whole of the UK on the interactive Great UK WaterBlitz map. Despite its relatively clean freshwater, the presence of unacceptable pollution levels in some of Wales’s tested sites highlights that challenges remain.
Our next Great UK WaterBlitz event will take place over four days in September.
Ongoing water testing throughout these events is crucial for establishing a comprehensive and dynamic picture of the nation’s freshwater health, enabling the identification of pollution hotspots, tracking changes over time, and providing vital data to advocate for stronger environmental policies.
If you are interested in taking part, fill in this form to get early access to the next event.
Clwyd
In Clwyd, we analysed 7 data points. Of these data points, 57% showed unacceptable levels of nutrient pollution. This compares to 18% in Wales overall, meaning that Clwyd had significantly worse than average water quality.
However, freshwater sites in Wales demonstrate significantly better conditions compared to England, where 61% of water samples showed unacceptable levels of nutrient pollution. You can explore all of the datapoints from Wales and the whole of the UK on the interactive Great UK WaterBlitz map. Despite its relatively clean freshwater, the presence of unacceptable pollution levels in some of Wales’s tested sites highlights that challenges remain.
Our next Great UK WaterBlitz event will take place over four days in September.
Ongoing water testing throughout these events is crucial for establishing a comprehensive and dynamic picture of the nation’s freshwater health, enabling the identification of pollution hotspots, tracking changes over time, and providing vital data to advocate for stronger environmental policies.
If you are interested in taking part, fill in this form to get early access to the next event.
Gwynedd
In Gwynedd, we analysed 23 data points. Of these data points, 22% showed unacceptable levels of nutrient pollution. This compares to 18% in Wales overall, meaning that Gwynedd had slightly worse than average water quality.
However, freshwater sites in Wales demonstrate significantly better conditions compared to England, where 61% of water samples showed unacceptable levels of nutrient pollution. You can explore all of the datapoints from Wales and the whole of the UK on the interactive Great UK WaterBlitz map. Despite its relatively clean freshwater, the presence of unacceptable pollution levels in some of Wales’s tested sites highlights that challenges remain.
Our next Great UK WaterBlitz event will take place over four days in September.
Ongoing water testing throughout these events is crucial for establishing a comprehensive and dynamic picture of the nation’s freshwater health, enabling the identification of pollution hotspots, tracking changes over time, and providing vital data to advocate for stronger environmental policies.
If you are interested in taking part, fill in this form to get early access to the next event.
West Glamorgan
In West Glamorgan, we analysed 5 data points. Of these data points, 0% showed unacceptable levels of nutrient pollution. This compares to 18% in Wales overall, meaning that West Glamorgan had better than average water quality.
Freshwater sites in Wales demonstrate significantly better conditions compared to England, where 61% of water samples showed unacceptable levels of nutrient pollution. You can explore all of the datapoints from Wales and the whole of the UK on the interactive Great UK WaterBlitz map. Despite its relatively clean freshwater, the presence of unacceptable pollution levels in some of Wales’s tested sites highlights that challenges remain.
Our next Great UK WaterBlitz event will take place over four days in September.
Ongoing water testing throughout these events is crucial for establishing a comprehensive and dynamic picture of the nation’s freshwater health, enabling the identification of pollution hotspots, tracking changes over time, and providing vital data to advocate for stronger environmental policies.
If you are interested in taking part, fill in this form to get early access to the next event.
South Glamorgan
In South Glamorgan, we analysed 12 data points. Of these data points, 17% showed unacceptable levels of nutrient pollution. This compares to 18% in Wales overall, meaning that South Glamorgan had slightly better than average water quality.
Freshwater sites in Wales demonstrate significantly better conditions compared to England, where 61% of water samples showed unacceptable levels of nutrient pollution. You can explore all of the datapoints from Wales and the whole of the UK on the interactive Great UK WaterBlitz map. Despite its relatively clean freshwater, the presence of unacceptable pollution levels in some of Wales’s tested sites highlights that challenges remain.
Our next Great UK WaterBlitz event will take place over four days in September.
Ongoing water testing throughout these events is crucial for establishing a comprehensive and dynamic picture of the nation’s freshwater health, enabling the identification of pollution hotspots, tracking changes over time, and providing vital data to advocate for stronger environmental policies.
If you are interested in taking part, fill in this form to get early access to the next event.
Durham
In Durham, we analysed 19 data points. Of these data points, 42% showed unacceptable levels of nutrient pollution. This compares to 61% in England overall, meaning that Durham had better than average water quality.
You can explore all of the datapoints from England and the whole of the UK on the interactive Great UK WaterBlitz map.
Our next Great UK WaterBlitz event will take place over four days in September.
Ongoing water testing throughout these events is crucial for establishing a comprehensive and dynamic picture of the nation’s freshwater health, enabling the identification of pollution hotspots, tracking changes over time, and providing vital data to advocate for stronger environmental policies.
If you are interested in taking part, fill in this form to get early access to the next event.
North Yorkshire
In North Yorkshire, we analysed 120 data points. Of these data points, 32% showed unacceptable levels of nutrient pollution. This compares to 61% in England overall, meaning that North Yorkshire had better than average water quality.
You can explore all of the datapoints from England and the whole of the UK on the interactive Great UK WaterBlitz map.
Our next Great UK WaterBlitz event will take place over four days in September.
Ongoing water testing throughout these events is crucial for establishing a comprehensive and dynamic picture of the nation’s freshwater health, enabling the identification of pollution hotspots, tracking changes over time, and providing vital data to advocate for stronger environmental policies.
If you are interested in taking part, fill in this form to get early access to the next event.
West Sussex
In West Sussex, we analysed 27 data points. Of these data points, 41% showed unacceptable levels of nutrient pollution. This compares to 61% in England overall, meaning that West Sussex had better than average water quality.
You can explore all of the datapoints from England and the whole of the UK on the interactive Great UK WaterBlitz map.
Our next Great UK WaterBlitz event will take place over four days in September.
Ongoing water testing throughout these events is crucial for establishing a comprehensive and dynamic picture of the nation’s freshwater health, enabling the identification of pollution hotspots, tracking changes over time, and providing vital data to advocate for stronger environmental policies.
If you are interested in taking part, fill in this form to get early access to the next event.
Tyne and Wear
In Tyne and Wear, we analysed 5 data points. Of these data points, 40% showed unacceptable levels of nutrient pollution. This compares to 61% in England overall, meaning that Tyne and Wear had better than average water quality.
You can explore all of the datapoints from England and the whole of the UK on the interactive Great UK WaterBlitz map.
Our next Great UK WaterBlitz event will take place over four days in September.
Ongoing water testing throughout these events is crucial for establishing a comprehensive and dynamic picture of the nation’s freshwater health, enabling the identification of pollution hotspots, tracking changes over time, and providing vital data to advocate for stronger environmental policies.
If you are interested in taking part, fill in this form to get early access to the next event.
Suffolk
In Suffolk, we analysed 37 data points. Of these data points, 76% showed unacceptable levels of nutrient pollution. This compares to 61% in England overall, meaning that Suffolk had worse than average water quality.
You can explore all of the datapoints from England and the whole of the UK on the interactive Great UK WaterBlitz map.
Our next Great UK WaterBlitz event will take place over four days in September.
Ongoing water testing throughout these events is crucial for establishing a comprehensive and dynamic picture of the nation’s freshwater health, enabling the identification of pollution hotspots, tracking changes over time, and providing vital data to advocate for stronger environmental policies.
If you are interested in taking part, fill in this form to get early access to the next event.
Somerset
In Somerset, we analysed 50 data points. Of these data points, 66% showed unacceptable levels of nutrient pollution. This compares to 61% in England overall, meaning that Somerset had worse than average water quality.
You can explore all of the datapoints from England and the whole of the UK on the interactive Great UK WaterBlitz map.
Our next Great UK WaterBlitz event will take place over four days in September.
Ongoing water testing throughout these events is crucial for establishing a comprehensive and dynamic picture of the nation’s freshwater health, enabling the identification of pollution hotspots, tracking changes over time, and providing vital data to advocate for stronger environmental policies.
If you are interested in taking part, fill in this form to get early access to the next event.
Norfolk
In Norfolk, we analysed 39 data points. Of these data points, 67% showed unacceptable levels of nutrient pollution. This compares to 61% in England overall, meaning that Norfolk had worse than average water quality.
You can explore all of the datapoints from England and the whole of the UK on the interactive Great UK WaterBlitz map.
Our next Great UK WaterBlitz event will take place over four days in September.
Ongoing water testing throughout these events is crucial for establishing a comprehensive and dynamic picture of the nation’s freshwater health, enabling the identification of pollution hotspots, tracking changes over time, and providing vital data to advocate for stronger environmental policies.
If you are interested in taking part, fill in this form to get early access to the next event.
Merseyside
In Merseyside, we analysed 11 data points. Of these data points, 0% showed unacceptable levels of nutrient pollution. This compares to 61% in England overall, meaning that Merseyside had better than average water quality.
You can explore all of the datapoints from England and the whole of the UK on the interactive Great UK WaterBlitz map.
Our next Great UK WaterBlitz event will take place over four days in September.
Ongoing water testing throughout these events is crucial for establishing a comprehensive and dynamic picture of the nation’s freshwater health, enabling the identification of pollution hotspots, tracking changes over time, and providing vital data to advocate for stronger environmental policies.
If you are interested in taking part, fill in this form to get early access to the next event.
Lincolnshire
In Lincolnshire, we analysed 50 data points. Of these data points, 82% showed unacceptable levels of nutrient pollution. This compares to 61% in England overall, meaning that Lincolnshire had worse than average water quality.
You can explore all of the datapoints from England and the whole of the UK on the interactive Great UK WaterBlitz map.
Our next Great UK WaterBlitz event will take place over four days in September.
Ongoing water testing throughout these events is crucial for establishing a comprehensive and dynamic picture of the nation’s freshwater health, enabling the identification of pollution hotspots, tracking changes over time, and providing vital data to advocate for stronger environmental policies.
If you are interested in taking part, fill in this form to get early access to the next event.
Lancashire
In Lancashire, we analysed 34 data points. Of these data points, 9% showed unacceptable levels of nutrient pollution. This compares to 61% in England overall, meaning that Lancashire had better than average water quality.
You can explore all of the datapoints from England and the whole of the UK on the interactive Great UK WaterBlitz map.
Our next Great UK WaterBlitz event will take place over four days in September.
Ongoing water testing throughout these events is crucial for establishing a comprehensive and dynamic picture of the nation’s freshwater health, enabling the identification of pollution hotspots, tracking changes over time, and providing vital data to advocate for stronger environmental policies.
If you are interested in taking part, fill in this form to get early access to the next event.
Kent
In Kent, we analysed 49 data points. Of these data points, 57% showed unacceptable levels of nutrient pollution. This compares to 61% in England overall, meaning that Kent had better than average water quality.
You can explore all of the datapoints from England and the whole of the UK on the interactive Great UK WaterBlitz map.
Our next Great UK WaterBlitz event will take place over four days in September.
Ongoing water testing throughout these events is crucial for establishing a comprehensive and dynamic picture of the nation’s freshwater health, enabling the identification of pollution hotspots, tracking changes over time, and providing vital data to advocate for stronger environmental policies.
If you are interested in taking part, fill in this form to get early access to the next event.
Hampshire
In Hampshire, we analysed 87 data points. Of these data points, 61% showed unacceptable levels of nutrient pollution. This compares to 61% in England overall, meaning that Hampshire had average water quality.
You can explore all of the datapoints from England and the whole of the UK on the interactive Great UK WaterBlitz map.
Our next Great UK WaterBlitz event will take place over four days in September.
Ongoing water testing throughout these events is crucial for establishing a comprehensive and dynamic picture of the nation’s freshwater health, enabling the identification of pollution hotspots, tracking changes over time, and providing vital data to advocate for stronger environmental policies.
If you are interested in taking part, fill in this form to get early access to the next event.
Gloucestershire
In Gloucestershire, we analysed 84 data points. Of these data points, 70% showed unacceptable levels of nutrient pollution. This compares to 61% in England overall, meaning that Gloucestershire had worse than average water quality.
You can explore all of the datapoints from England and the whole of the UK on the interactive Great UK WaterBlitz map.
Our next Great UK WaterBlitz event will take place over four days in September.
Ongoing water testing throughout these events is crucial for establishing a comprehensive and dynamic picture of the nation’s freshwater health, enabling the identification of pollution hotspots, tracking changes over time, and providing vital data to advocate for stronger environmental policies.
If you are interested in taking part, fill in this form to get early access to the next event.
Essex
In Essex, we analysed 43 data points. Of these data points, 74% showed unacceptable levels of nutrient pollution. This compares to 61% in England overall, meaning that Essex had worse than average water quality.
You can explore all of the datapoints from England and the whole of the UK on the interactive Great UK WaterBlitz map.
Our next Great UK WaterBlitz event will take place over four days in September.
Ongoing water testing throughout these events is crucial for establishing a comprehensive and dynamic picture of the nation’s freshwater health, enabling the identification of pollution hotspots, tracking changes over time, and providing vital data to advocate for stronger environmental policies.
If you are interested in taking part, fill in this form to get early access to the next event.
East Sussex
In East Sussex, we analysed 18 data points. Of these data points, 39% showed unacceptable levels of nutrient pollution. This compares to 61% in England overall, meaning that East Sussex had better than average water quality.
You can explore all of the datapoints from England and the whole of the UK on the interactive Great UK WaterBlitz map.
Our next Great UK WaterBlitz event will take place over four days in September.
Ongoing water testing throughout these events is crucial for establishing a comprehensive and dynamic picture of the nation’s freshwater health, enabling the identification of pollution hotspots, tracking changes over time, and providing vital data to advocate for stronger environmental policies.
If you are interested in taking part, fill in this form to get early access to the next event.
East Riding of Yorkshire
In East Riding of Yorkshire, we analysed 14 data points. Of these data points, 86% showed unacceptable levels of nutrient pollution. This compares to 61% in England overall, meaning that East Riding of Yorkshire had some of the worst water quality in England.
You can explore all of the datapoints from England and the whole of the UK on the interactive Great UK WaterBlitz map.
Our next Great UK WaterBlitz event will take place over four days in September.
Ongoing water testing throughout these events is crucial for establishing a comprehensive and dynamic picture of the nation’s freshwater health, enabling the identification of pollution hotspots, tracking changes over time, and providing vital data to advocate for stronger environmental policies.
If you are interested in taking part, fill in this form to get early access to the next event.
Dorset
In Dorset, we analysed 76 data points. Of these data points, 68% showed unacceptable levels of nutrient pollution. This compares to 61% in England overall, meaning that Dorset had worse than average water quality.
You can explore all of the datapoints from England and the whole of the UK on the interactive Great UK WaterBlitz map.
Our next Great UK WaterBlitz event will take place over four days in September.
Ongoing water testing throughout these events is crucial for establishing a comprehensive and dynamic picture of the nation’s freshwater health, enabling the identification of pollution hotspots, tracking changes over time, and providing vital data to advocate for stronger environmental policies.
If you are interested in taking part, fill in this form to get early access to the next event.
Devon
In Devon, we analysed 86 data points. Of these data points, 37% showed unacceptable levels of nutrient pollution. This compares to 61% in England overall, meaning that Devon had better than average water quality.
You can explore all of the datapoints from England and the whole of the UK on the interactive Great UK WaterBlitz map.
Our next Great UK WaterBlitz event will take place over four days in September.
Ongoing water testing throughout these events is crucial for establishing a comprehensive and dynamic picture of the nation’s freshwater health, enabling the identification of pollution hotspots, tracking changes over time, and providing vital data to advocate for stronger environmental policies.
If you are interested in taking part, fill in this form to get early access to the next event.
Bristol
In Bristol, we analysed 7 data points. Of these data points, 100% showed unacceptable levels of nutrient pollution. This compares to 61% in England overall, meaning that Bristol had significantly worse than average water quality.
You can explore all of the datapoints from England and the whole of the UK on the interactive Great UK WaterBlitz map.
Our next Great UK WaterBlitz event will take place over four days in September.
Ongoing water testing throughout these events is crucial for establishing a comprehensive and dynamic picture of the nation’s freshwater health, enabling the identification of pollution hotspots, tracking changes over time, and providing vital data to advocate for stronger environmental policies.
If you are interested in taking part, fill in this form to get early access to the next event.
Roxburgh, Ettrick and Lauderdale
In Roxburgh, Ettrick and Lauderdale, we analysed 9 data points. Of these data points, 44% showed unacceptable levels of nutrient pollution. This compares to 26% in Scotland overall, meaning that Roxburgh, Ettrick and Lauderdale had worse than average water quality.
However, freshwater sites in Scotland demonstrate significantly better conditions compared to England, where 61% of water samples showed unacceptable levels of nutrient pollution. You can explore all of the datapoints from Scotland and the whole of the UK on the interactive Great UK WaterBlitz map. Despite its relatively clean freshwater, the presence of unacceptable pollution levels in some of Scotland’s tested sites highlights that challenges remain.
Our next Great UK WaterBlitz event will take place over four days in September.
Ongoing water testing throughout these events is crucial for establishing a comprehensive and dynamic picture of the nation’s freshwater health, enabling the identification of pollution hotspots, tracking changes over time, and providing vital data to advocate for stronger environmental policies.
If you are interested in taking part, fill in this form to get early access to the next event.
Tweeddale
We did not receive enough data points from Tweeddale to undertake meaningful analysis of the county’s water quality. However, in Scotland, we analysed 106 datapoints, of which, 26% were found to have unacceptable levels of nutrient pollution.
You can explore all of the datapoints from England and the whole of the UK on the interactive Great UK WaterBlitz map.
Our next Great UK WaterBlitz event will take place over four days in September.
Ongoing water testing throughout these events is crucial for establishing a comprehensive and dynamic picture of the nation’s freshwater health, enabling the identification of pollution hotspots, tracking changes over time, and providing vital data to advocate for stronger environmental policies.
If you are interested in taking part, fill in this form to get early access to the next event.
Greater London
In Greater London, we analysed 108 data points. Of these data points, 62% showed unacceptable levels of nutrient pollution. This compares to 61% in England overall, meaning that Greater London had worse than average water quality.
You can explore all of the datapoints from England and the whole of the UK on the interactive Great UK WaterBlitz map.
Our next Great UK WaterBlitz event will take place over four days in September.
Ongoing water testing throughout these events is crucial for establishing a comprehensive and dynamic picture of the nation’s freshwater health, enabling the identification of pollution hotspots, tracking changes over time, and providing vital data to advocate for stronger environmental policies.
If you are interested in taking part, fill in this form to get early access to the next event.
Powys
In Powys, we analysed 12 data points. Of these data points, 0% showed unacceptable levels of nutrient pollution. This compares to 18% in Wales overall, meaning that Powys had better than average water quality.
Freshwater sites in Wales demonstrate significantly better conditions compared to England, where 61% of water samples showed unacceptable levels of nutrient pollution. You can explore all of the datapoints from Wales and the whole of the UK on the interactive Great UK WaterBlitz map. Despite its relatively clean freshwater, the presence of unacceptable pollution levels in some of Wales’s tested sites highlights that challenges remain.
Our next Great UK WaterBlitz event will take place over four days in September.
Ongoing water testing throughout these events is crucial for establishing a comprehensive and dynamic picture of the nation’s freshwater health, enabling the identification of pollution hotspots, tracking changes over time, and providing vital data to advocate for stronger environmental policies.
If you are interested in taking part, fill in this form to get early access to the next event.
Herefordshire
In Herefordshire, we analysed 13 data points. Of these data points, 77% showed unacceptable levels of nutrient pollution. This compares to 61% in England overall, meaning that Herefordshire had worse than average water quality.
You can explore all of the datapoints from England and the whole of the UK on the interactive Great UK WaterBlitz map.
Our next Great UK WaterBlitz event will take place over four days in September.
Ongoing water testing throughout these events is crucial for establishing a comprehensive and dynamic picture of the nation’s freshwater health, enabling the identification of pollution hotspots, tracking changes over time, and providing vital data to advocate for stronger environmental policies.
If you are interested in taking part, fill in this form to get early access to the next event.
Worcestershire
In Worcestershire, we analysed 44 data points. Of these data points, 52% showed unacceptable levels of nutrient pollution. This compares to 61% in England overall, meaning that Worcestershire had better than average water quality.
You can explore all of the datapoints from England and the whole of the UK on the interactive Great UK WaterBlitz map.
Our next Great UK WaterBlitz event will take place over four days in September.
Ongoing water testing throughout these events is crucial for establishing a comprehensive and dynamic picture of the nation’s freshwater health, enabling the identification of pollution hotspots, tracking changes over time, and providing vital data to advocate for stronger environmental policies.
If you are interested in taking part, fill in this form to get early access to the next event.
Wiltshire
In Wiltshire, we analysed 74 data points. Of these data points, 81% showed unacceptable levels of nutrient pollution. This compares to 61% in England overall, meaning that Wiltshire had worse than average water quality.
You can explore all of the datapoints from England and the whole of the UK on the interactive Great UK WaterBlitz map.
Our next Great UK WaterBlitz event will take place over four days in September.
Ongoing water testing throughout these events is crucial for establishing a comprehensive and dynamic picture of the nation’s freshwater health, enabling the identification of pollution hotspots, tracking changes over time, and providing vital data to advocate for stronger environmental policies.
If you are interested in taking part, fill in this form to get early access to the next event.
West Yorkshire
In West Yorkshire, we analysed 84 data points. Of these data points, 36% showed unacceptable levels of nutrient pollution. This compares to 61% in England overall, meaning that West Yorkshire had better than average water quality.
You can explore all of the datapoints from England and the whole of the UK on the interactive Great UK WaterBlitz map.
Our next Great UK WaterBlitz event will take place over four days in September.
Ongoing water testing throughout these events is crucial for establishing a comprehensive and dynamic picture of the nation’s freshwater health, enabling the identification of pollution hotspots, tracking changes over time, and providing vital data to advocate for stronger environmental policies.
If you are interested in taking part, fill in this form to get early access to the next event.
West Midlands
In West Midlands, we analysed 17 data points. Of these data points, 47% showed unacceptable levels of nutrient pollution. This compares to 61% in England overall, meaning that West Midlands had better than average water quality.
You can explore all of the datapoints from England and the whole of the UK on the interactive Great UK WaterBlitz map.
Our next Great UK WaterBlitz event will take place over four days in September.
Ongoing water testing throughout these events is crucial for establishing a comprehensive and dynamic picture of the nation’s freshwater health, enabling the identification of pollution hotspots, tracking changes over time, and providing vital data to advocate for stronger environmental policies.
If you are interested in taking part, fill in this form to get early access to the next event.
Warwickshire
In Warwickshire, we analysed 42 data points. Of these data points, 88% showed unacceptable levels of nutrient pollution. This compares to 61% in England overall, meaning that Warwickshire had worse than average water quality.
You can explore all of the datapoints from England and the whole of the UK on the interactive Great UK WaterBlitz map.
Our next Great UK WaterBlitz event will take place over four days in September.
Ongoing water testing throughout these events is crucial for establishing a comprehensive and dynamic picture of the nation’s freshwater health, enabling the identification of pollution hotspots, tracking changes over time, and providing vital data to advocate for stronger environmental policies.
If you are interested in taking part, fill in this form to get early access to the next event.
Surrey
In Surrey, we analysed 42 data points. Of these data points, 71% showed unacceptable levels of nutrient pollution. This compares to 61% in England overall, meaning that Surrey had worse than average water quality.
You can explore all of the datapoints from England and the whole of the UK on the interactive Great UK WaterBlitz map.
Our next Great UK WaterBlitz event will take place over four days in September.
Ongoing water testing throughout these events is crucial for establishing a comprehensive and dynamic picture of the nation’s freshwater health, enabling the identification of pollution hotspots, tracking changes over time, and providing vital data to advocate for stronger environmental policies.
If you are interested in taking part, fill in this form to get early access to the next event.
Staffordshire
In Staffordshire, we analysed 36 data points. Of these data points, 75% showed unacceptable levels of nutrient pollution. This compares to 61% in England overall, meaning that Staffordshire had worse than average water quality.
You can explore all of the datapoints from England and the whole of the UK on the interactive Great UK WaterBlitz map.
Our next Great UK WaterBlitz event will take place over four days in September.
Ongoing water testing throughout these events is crucial for establishing a comprehensive and dynamic picture of the nation’s freshwater health, enabling the identification of pollution hotspots, tracking changes over time, and providing vital data to advocate for stronger environmental policies.
If you are interested in taking part, fill in this form to get early access to the next event.
South Yorkshire
In South Yorkshire, we analysed 38 data points. Of these data points, 37% showed unacceptable levels of nutrient pollution. This compares to 61% in England overall, meaning that South Yorkshire had better than average water quality.
You can explore all of the datapoints from England and the whole of the UK on the interactive Great UK WaterBlitz map.
Our next Great UK WaterBlitz event will take place over four days in September.
Ongoing water testing throughout these events is crucial for establishing a comprehensive and dynamic picture of the nation’s freshwater health, enabling the identification of pollution hotspots, tracking changes over time, and providing vital data to advocate for stronger environmental policies.
If you are interested in taking part, fill in this form to get early access to the next event.
Shropshire
In Shropshire, we analysed 18 data points. Of these data points, 50% showed unacceptable levels of nutrient pollution. This compares to 61% in England overall, meaning that Shropshire had better than average water quality.
You can explore all of the datapoints from England and the whole of the UK on the interactive Great UK WaterBlitz map.
Our next Great UK WaterBlitz event will take place over four days in September.
Ongoing water testing throughout these events is crucial for establishing a comprehensive and dynamic picture of the nation’s freshwater health, enabling the identification of pollution hotspots, tracking changes over time, and providing vital data to advocate for stronger environmental policies.
If you are interested in taking part, fill in this form to get early access to the next event.
Oxfordshire
In Oxfordshire, we analysed 131 data points. Of these data points, 86% showed unacceptable levels of nutrient pollution. This compares to 61% in England overall, meaning that Oxfordshire had worse than average water quality.
You can explore all of the datapoints from England and the whole of the UK on the interactive Great UK WaterBlitz map.
Our next Great UK WaterBlitz event will take place over four days in September.
Ongoing water testing throughout these events is crucial for establishing a comprehensive and dynamic picture of the nation’s freshwater health, enabling the identification of pollution hotspots, tracking changes over time, and providing vital data to advocate for stronger environmental policies.
If you are interested in taking part, fill in this form to get early access to the next event.
Nottinghamshire
In Nottinghamshire, we analysed 28 data points. Of these data points, 89% showed unacceptable levels of nutrient pollution. This compares to 61% in England overall, meaning that Nottinghamshire had worse than average water quality.
You can explore all of the datapoints from England and the whole of the UK on the interactive Great UK WaterBlitz map.
Our next Great UK WaterBlitz event will take place over four days in September.
Ongoing water testing throughout these events is crucial for establishing a comprehensive and dynamic picture of the nation’s freshwater health, enabling the identification of pollution hotspots, tracking changes over time, and providing vital data to advocate for stronger environmental policies.
If you are interested in taking part, fill in this form to get early access to the next event.
Rutland
In Rutland, we analysed 7 data points. Of these data points, 100% showed unacceptable levels of nutrient pollution. This compares to 61% in England overall, meaning that Rutland had significantly worse than average water quality.
You can explore all of the datapoints from England and the whole of the UK on the interactive Great UK WaterBlitz map.
Our next Great UK WaterBlitz event will take place over four days in September.
Ongoing water testing throughout these events is crucial for establishing a comprehensive and dynamic picture of the nation’s freshwater health, enabling the identification of pollution hotspots, tracking changes over time, and providing vital data to advocate for stronger environmental policies.
If you are interested in taking part, fill in this form to get early access to the next event.
Northamptonshire
In Northamptonshire, we analysed 31 data points. Of these data points, 77% showed unacceptable levels of nutrient pollution. This compares to 61% in England overall, meaning that Northamptonshire had worse than average water quality.
You can explore all of the datapoints from England and the whole of the UK on the interactive Great UK WaterBlitz map.
Our next Great UK WaterBlitz event will take place over four days in September.
Ongoing water testing throughout these events is crucial for establishing a comprehensive and dynamic picture of the nation’s freshwater health, enabling the identification of pollution hotspots, tracking changes over time, and providing vital data to advocate for stronger environmental policies.
If you are interested in taking part, fill in this form to get early access to the next event.
Leicestershire
In Leicestershire, we analysed 34 data points. Of these data points, 65% showed unacceptable levels of nutrient pollution. This compares to 61% in England overall, meaning that Leicestershire had worse than average water quality.
You can explore all of the datapoints from England and the whole of the UK on the interactive Great UK WaterBlitz map.
Our next Great UK WaterBlitz event will take place over four days in September.
Ongoing water testing throughout these events is crucial for establishing a comprehensive and dynamic picture of the nation’s freshwater health, enabling the identification of pollution hotspots, tracking changes over time, and providing vital data to advocate for stronger environmental policies.
If you are interested in taking part, fill in this form to get early access to the next event.
Hertfordshire
In Hertfordshire, we analysed 60 data points. Of these data points, 73% showed unacceptable levels of nutrient pollution. This compares to 61% in England overall, meaning that Hertfordshire had worse than average water quality.
You can explore all of the datapoints from England and the whole of the UK on the interactive Great UK WaterBlitz map.
Our next Great UK WaterBlitz event will take place over four days in September.
Ongoing water testing throughout these events is crucial for establishing a comprehensive and dynamic picture of the nation’s freshwater health, enabling the identification of pollution hotspots, tracking changes over time, and providing vital data to advocate for stronger environmental policies.
If you are interested in taking part, fill in this form to get early access to the next event.
Greater Manchester
In Greater Manchester, we analysed 27 data points. Of these data points, 52% showed unacceptable levels of nutrient pollution. This compares to 61% in England overall, meaning that Greater Manchester had better than average water quality.
You can explore all of the datapoints from England and the whole of the UK on the interactive Great UK WaterBlitz map.
Our next Great UK WaterBlitz event will take place over four days in September.
Ongoing water testing throughout these events is crucial for establishing a comprehensive and dynamic picture of the nation’s freshwater health, enabling the identification of pollution hotspots, tracking changes over time, and providing vital data to advocate for stronger environmental policies.
If you are interested in taking part, fill in this form to get early access to the next event.
Derbyshire
In Derbyshire, we analysed 47 data points. Of these data points, 55% showed unacceptable levels of nutrient pollution. This compares to 61% in England overall, meaning that Derbyshire had better than average water quality.
You can explore all of the datapoints from England and the whole of the UK on the interactive Great UK WaterBlitz map.
Our next Great UK WaterBlitz event will take place over four days in September.
Ongoing water testing throughout these events is crucial for establishing a comprehensive and dynamic picture of the nation’s freshwater health, enabling the identification of pollution hotspots, tracking changes over time, and providing vital data to advocate for stronger environmental policies.
If you are interested in taking part, fill in this form to get early access to the next event.
Cheshire
In Cheshire, we analysed 32 data points. Of these data points, 56% showed unacceptable levels of nutrient pollution. This compares to 61% in England overall, meaning that Cheshire had better than average water quality.
You can explore all of the datapoints from England and the whole of the UK on the interactive Great UK WaterBlitz map.
Our next Great UK WaterBlitz event will take place over four days in September.
Ongoing water testing throughout these events is crucial for establishing a comprehensive and dynamic picture of the nation’s freshwater health, enabling the identification of pollution hotspots, tracking changes over time, and providing vital data to advocate for stronger environmental policies.
If you are interested in taking part, fill in this form to get early access to the next event.
Cambridgeshire
In Cambridgeshire, we analysed 41 data points. Of these data points, 80% showed unacceptable levels of nutrient pollution. This compares to 61% in England overall, meaning that Cambridgeshire had worse than average water quality.
You can explore all of the datapoints from England and the whole of the UK on the interactive Great UK WaterBlitz map.
Our next Great UK WaterBlitz event will take place over four days in September.
Ongoing water testing throughout these events is crucial for establishing a comprehensive and dynamic picture of the nation’s freshwater health, enabling the identification of pollution hotspots, tracking changes over time, and providing vital data to advocate for stronger environmental policies.
If you are interested in taking part, fill in this form to get early access to the next event.
Buckinghamshire
In Buckinghamshire, we analysed 29 data points. Of these data points, 86% showed unacceptable levels of nutrient pollution. This compares to 61% in England overall, meaning that Buckinghamshire had some of the worst water quality in England.
You can explore all of the datapoints from England and the whole of the UK on the interactive Great UK WaterBlitz map.
Our next Great UK WaterBlitz event will take place over four days in September.
Ongoing water testing throughout these events is crucial for establishing a comprehensive and dynamic picture of the nation’s freshwater health, enabling the identification of pollution hotspots, tracking changes over time, and providing vital data to advocate for stronger environmental policies.
If you are interested in taking part, fill in this form to get early access to the next event.
Berkshire
In Berkshire, we analysed 51 data points. Of these data points, 78% showed unacceptable levels of nutrient pollution. This compares to 61% in England overall, meaning that Berkshire had worse than average water quality.
You can explore all of the datapoints from England and the whole of the UK on the interactive Great UK WaterBlitz map.
Our next Great UK WaterBlitz event will take place over four days in September.
Ongoing water testing throughout these events is crucial for establishing a comprehensive and dynamic picture of the nation’s freshwater health, enabling the identification of pollution hotspots, tracking changes over time, and providing vital data to advocate for stronger environmental policies.
If you are interested in taking part, fill in this form to get early access to the next event.
Bedfordshire
In Bedfordshire, we analysed 49 data points. Of these data points, 90% showed unacceptable levels of nutrient pollution. This compares to 61% in England overall, meaning that Bedfordshire had some of the worst water quality in England.
You can explore all of the datapoints from England and the whole of the UK on the interactive Great UK WaterBlitz map.
Our next Great UK WaterBlitz event will take place over four days in September.
Ongoing water testing throughout these events is crucial for establishing a comprehensive and dynamic picture of the nation’s freshwater health, enabling the identification of pollution hotspots, tracking changes over time, and providing vital data to advocate for stronger environmental policies.
If you are interested in taking part, fill in this form to get early access to the next event.
Read the Great UK WaterBlitz Spring 2026 Report

Support the Great UK WaterBlitz
It costs £6 for each water testing kit used in the Great UK WaterBlitz and we rely on voluntary donations to support our work. Every donation means that we can test more waterbodies in more locations across the UK. Please donate to make the Great UK WaterBlitz as big as possible.