Great UK WaterBlitz Autumn 2025 Report
4th November 2025
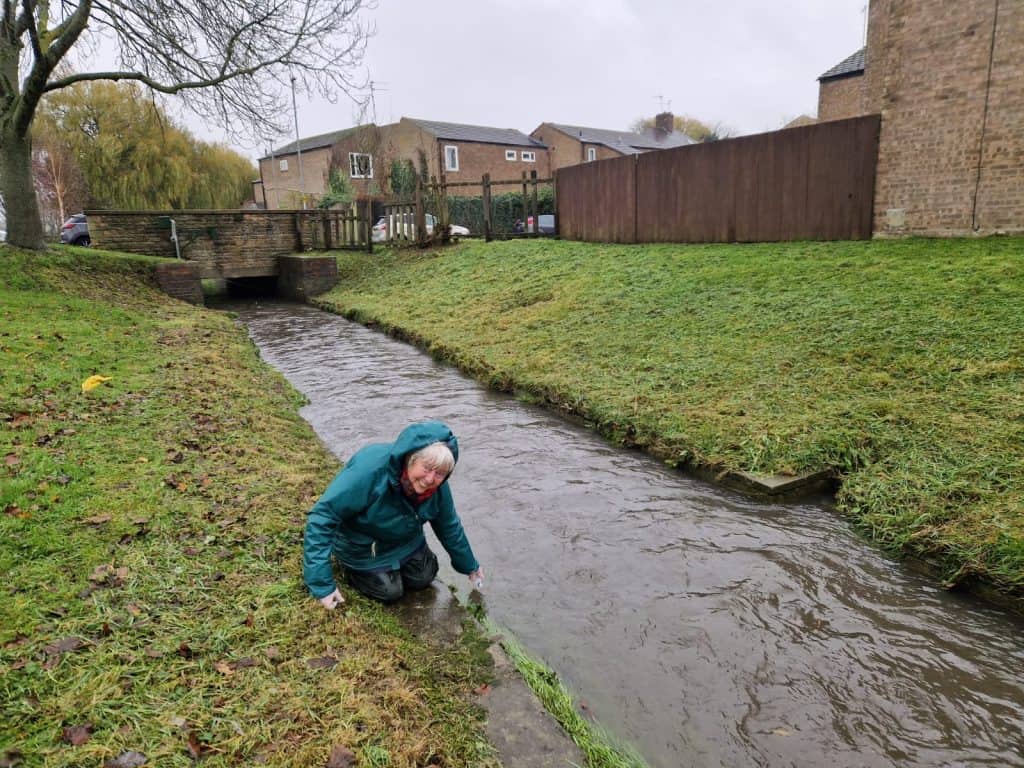
Between 19-22 September 2025, 5,708 citizen scientists surveyed 3,430 freshwater sites; creating a comprehensive citizen-led snapshot of water quality across the UK.
The report’s key findings
- 60% of datapoints across the UK show poor water quality, with unacceptable levels of nutrient pollution
- Over four WaterBlitzes, England consistently has the worst water quality in the UK; this autumn 66% of sites tested had unacceptable levels of nutrient pollution
- Once again, our data suggest the Thames river basin district has the worst water quality in the UK, with 81% of measurements showing unacceptable levels of nutrient pollution; despite the Thames Tideway Tunnel becoming fully operational in February of this year
- The counties of Tyrone in Northern Ireland, Mid Glamorgan in Wales, and the four counties of Argyll and Bute, Ayrshire and Arran, City of Aberdeen and Dunbartonshire in Scotland have the best water quality, with 100% of measurements indicating low levels of pollution
- In England, the county of Northumberland has the best water quality, with 94% of measurements indicating good ecological status
- Cambridgeshire has the worst water quality in the UK, with 91% of measurements indicating poor ecological status
- Every freshwater sample has additional chemical contamination evidencing pollution from sewage discharges and agricultural runoff
- Of the 20 chemicals assessed, 12 of them are present at concentrations that pose risks to aquatic life
- Antibiotics are found at concentrations that suggest we should consider antimicrobial resistance developing in our freshwaters
- Illicit drugs such as ketamine are prevalent in our waterways (although they pose limited risk to aquatic life)
- The insecticide imidacloprid is found at high concentrations in some samples from across the UK; posing moderate to high risk to aquatics invertebrates which are vitally important for ecological health

Freshwater quality across the UK
Thousands of citizen scientists uploaded data from across the UK. Of the 3,430 surveys, 2,856 were collected in England; 200 were collected in Scotland; 208 measurements were taken in Wales; and 166 datapoints were gathered in Northern Ireland.
The data indicate that England has the worst water quality in the UK, which is consistent with the findings of the three previous Great UK WaterBlitz events.

66% of measurements taken across England’s waters indicate unacceptable levels of nutrient pollution. In comparison 32% of measurements in Scotland and 27% of measurements in Wales and Northern Ireland showed poor water quality.

As we continue to collect more data over repeated WaterBlitzes the findings of previous WaterBlitzes are confirmed as a trend.
Taking the average across all four WaterBlitzes, 34% of measurements in Wales and Northern Ireland, and 36% of measurements taken in Scotland indicate poor water quality.
In comparison, 71% of measurements in England indicate poor water quality.

Why is nutrient pollution a problem?
Nitrates and phosphates occur naturally in the environment and are essential for plant growth. In high concentrations, nitrates and phosphates can lead to a process called eutrophication. This process is when excessive plant and algal growth (caused by the extra nutrients) leads to high levels of bacteria. The bacteria decrease oxygen levels in the water, killing plants and animals.
Lots of algae on the water’s surface can also choke waterways preventing wildlife from feeding, and block sunlight causing further problems for aquatic plants. Over time, with continued high levels of nutrients, river ecosystems can fail.